Why is SQL Server So Slow?
I’ve been asked this question a few times when looking into performance problems on a website, and the short answer is, it’s not. SQL Server is a very efficient database.
It’s important to remember that a database is just a runtime for your SQL code. It’s just doing what you ask it to do, nothing more, nothing less.
This applies to any database. MySQL, PostgreSQL, maybe even Oracle are all just agents that do your bidding. But I'm most familiar with SQL Server's tools for finding and fixing some common problems, so that's what I'm going to talk about here.
Typically what happens is something like this:
- You develop an application.
- You test it. It works okay.
- You add some test data and test it with a “lot� of rows. It still works okay.
- You deploy it.
Then, maybe a few weeks, maybe a few years later, you, or your successor, notices that the application or website’s response is slow, and it turns out, it’s the database’s fault. The conclusion is that the database is slow, and plans are made to replace it.
The problem with this scenario is that the database probably isn’t the problem. The performance characteristics of any of the major databases are all close enough that switching from one to the other without some optimizing in the process would not help. Do that same optimizing to the existing system and you won’t need to switch.
First off, how was the conclusion reached that the database is slow?
Both Windows and SQL Server give you some excellent tools for diagnosing your problem.
First, look at the CPU usage of the SQL Server process.

Either it will be very low, very high, or somewhere in between.
Ideally it will be somewhere in between, but generally low. If it's pegged at 100% then you're probably running a query that's got all the data it needs in memory, and SQL Server is being forced to do something rather inefficient with it, like stepping through all the rows adding the value of some field for example. This can be a symptom of throwing RAM at the problem without optimizing, and will stop being a solution once the data outgrows memory again.
Often what you see, though, is that SQL Server's CPU usage is very low, but the system's paging activity is very high. This signifies that the system is starved for memory, and is swapping. SQL Server shows low CPU usage because it's busy waiting for the disk to deliver some pages.

This screenshot shows a pretty good situation: Just a bit of paging activity going on. If you're seeing hundreds of pages per second constantly, you've got a problem. Swapping will kill your server's performance.
If you have a query like "select * from users where lastname = 'bob'" and you don't have an index on lastname, then what you're doing is asking SQL Server to read every single row from table users and build a set of matching rows. This is called a table scan. You want to avoid table scans.
This is the #1 cause of SQL Server slowdown over time: Not having the right indexes.
When executing a table scan, the server needs to read every row of the table. This thrashes SQL Server's cache, so that now other data cached for other queries has been tossed out and now those other queries have to hit the disk. This means even an occasional table scan is a bad thing.
Here's how to gain a little visibility into what's causing your problems. First off, launch the SQL Profiler.
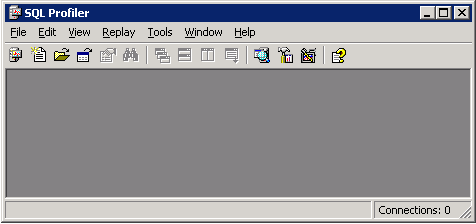
This tool lets you spy on what's going on inside your server. Create a new trace:
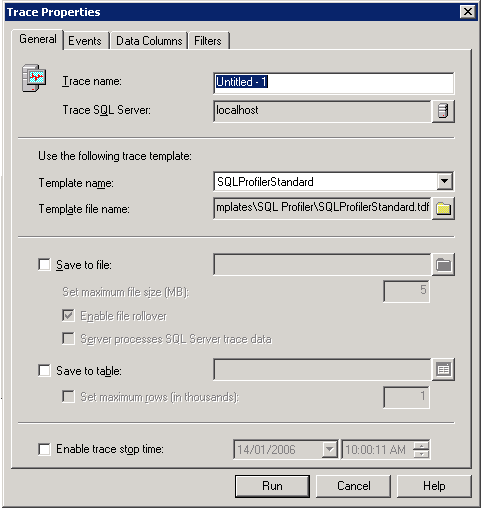
The defaults here are good. Hit Run.
While it's running, SQL Profiler is gathering data on every query your server executes. Launch your application or visit your website and do some of the things that are causing the performance problems. This gives the profiler, and the next tool, the Index Tuning Wizard, some data to work with. When you've got a good data sample, stop the trace.
Before using the Index Tuning Wizard, take a look at the result data. The Reads column and the Duration column are two of the most useful: Reads tells you how many disk pages needed to be read to satisfy this query, and Duration tells you how long it took (in milliseconds).

The highlighted line read 296972 pages, and took 29 seconds. Looks like a problem, doesn't it?
You can use this data to do some manual tweaking; often the problem is immediately obvious. But your next new friend, the Index Tuning Wizard, will help.
Save your current profile run as a Trace File (*.trc), and then on the Tools menu of the profiler, select the Index Tuning Wizard.

It's best to select Thorough if you're working with a fairly small data set.
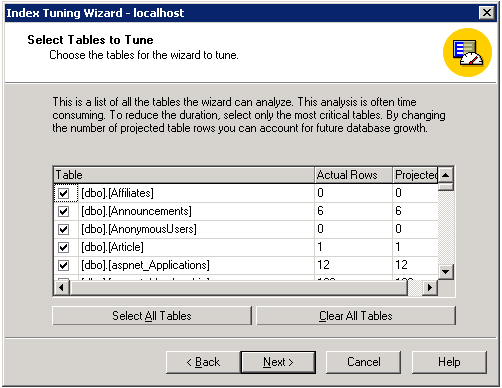
Unless you're looking for a very specific problem or have a huge data set, select all the tables. The more the wizard has to look at, the better.
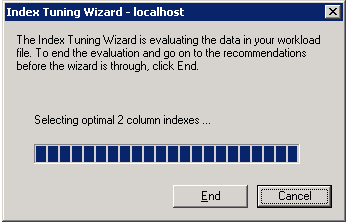
With any luck, the next page will tell you that the Wizard is going to fix all your problems.
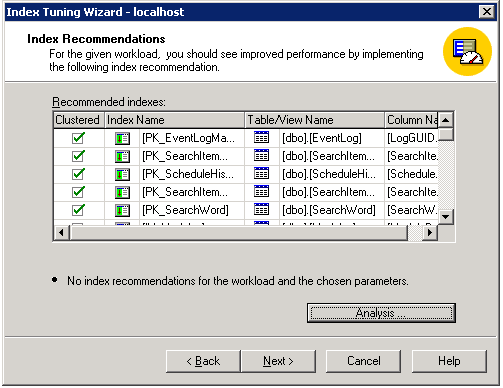
No such luck in this case: No recommendations were found. But lets look at another example in a different tool: Say you've seen one particular query in the Profiler that you're suspicious of. Launch the Query Analyzer, enter the query, and bring up the Index Tuning Wizard from there.
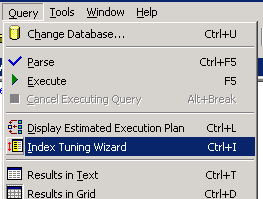
When you launch the wizard this way, one of the options is to use the Query Analyzer selection as the query to tune indexes for. I typed in a query that's going to cause a table scan:
select count(*) from eventlog where logportalname = 'bob'
The logproperties field of the eventlog table doesn't have an index. Here's what the tuning wizard gives me for this:

Now there's a nice projected outcome: A 95% performance improvement! A few clicks and you can have SQL Server apply the changes for you, or create a scheduled job to apply the changes later (during a scheduled maintenance period, for example). You can apply the changes to a live database, but queries on the table being indexed will block until the operation is complete, which could take a while.
But back to the case where the wizard didn't find anything that could help you. Another thing that often happens is that you've got a massive table because you wrote code to put things into it, but never to take anything out of it. You create a log table, or an errors table, or a hits table, write code to put things there, and forget about it.
If you see a query or an insert that's hitting thousands of rows, count the rows in the table.
select count(*) from eventlog
If you see a few million rows, then that's your problem.
When you insert into a table, there's work to do, and the bigger the table, the more work. If your eventlog table has a few indexes on it, those need to be updated when you insert, and the indexes on a table with millions of rows are going to take more IO operations to update than inserting into the same table with only a few thousand rows.
The best way I've found to manage this is to use SQL Server's Jobs to automatically clean things up at regular intervals. Check out the Jobs section of the Enterprise Manager:

A job is work SQL Server will do for you at scheduled times. Create a new job.

This is a sample job. It's got the 3 steps listed that it's going to take, one after the other, that will drop old data from a database. A job step is just some SQL to execute:

If you're going to have multiple steps for a job, don't forget to go to the Advanced tab and set up the job actions - each job should go to the next job when it's done, except the last one, which should report success.

Set up the job to run at some regular interval, and that's it - you've guaranteed that your table isn't going to grow unbounded until it starts causing you problems again.

There you go - Hope all this helps! If you have any other SQL Server optimization tips please post them.